Leasing Budget Automation
Python + SQL + Excel = Fully Integrated Rent Forecasts💼 Executive Summary
This solution automates leasing budget forecasting across 400+ tenants across 100+ commercial properties, covering more than 700 active lease exposures. It bridges Yardi data queried by SQL, Excel inputs, and Python processing to generate a 5–7 year outlook for base rent, vacancy, and GLA — fully integrated into a dynamic Excel workbook.
- Portfolio: Office, Retail, Industrial properties
- Forecasting Horizon: 2025 to 2029
- Tools: Excel, Python (pandas, xlwings), SQL (Athena), SharePoint, Task Scheduler
- Output: Excel workbook with dynamic projections, rent roll validations, and summary reports
Fully integrated into a dynamic Excel workbook.
📌 Table of Contents
📈 Business Impact
- ✅ Replaced manual workbooks with automated Python logic
- ⚡ ⏱️ Reduced from 3 weeks to 10 minutes
- 🔍 Created a single source of truth for all leasing assumptions
- 🧾 Enabled quick summary generation for budget sign-off
Simplified Leasing Flow
This diagram provides a high-level overview of the leasing process used to generate projections from multiple data sources.
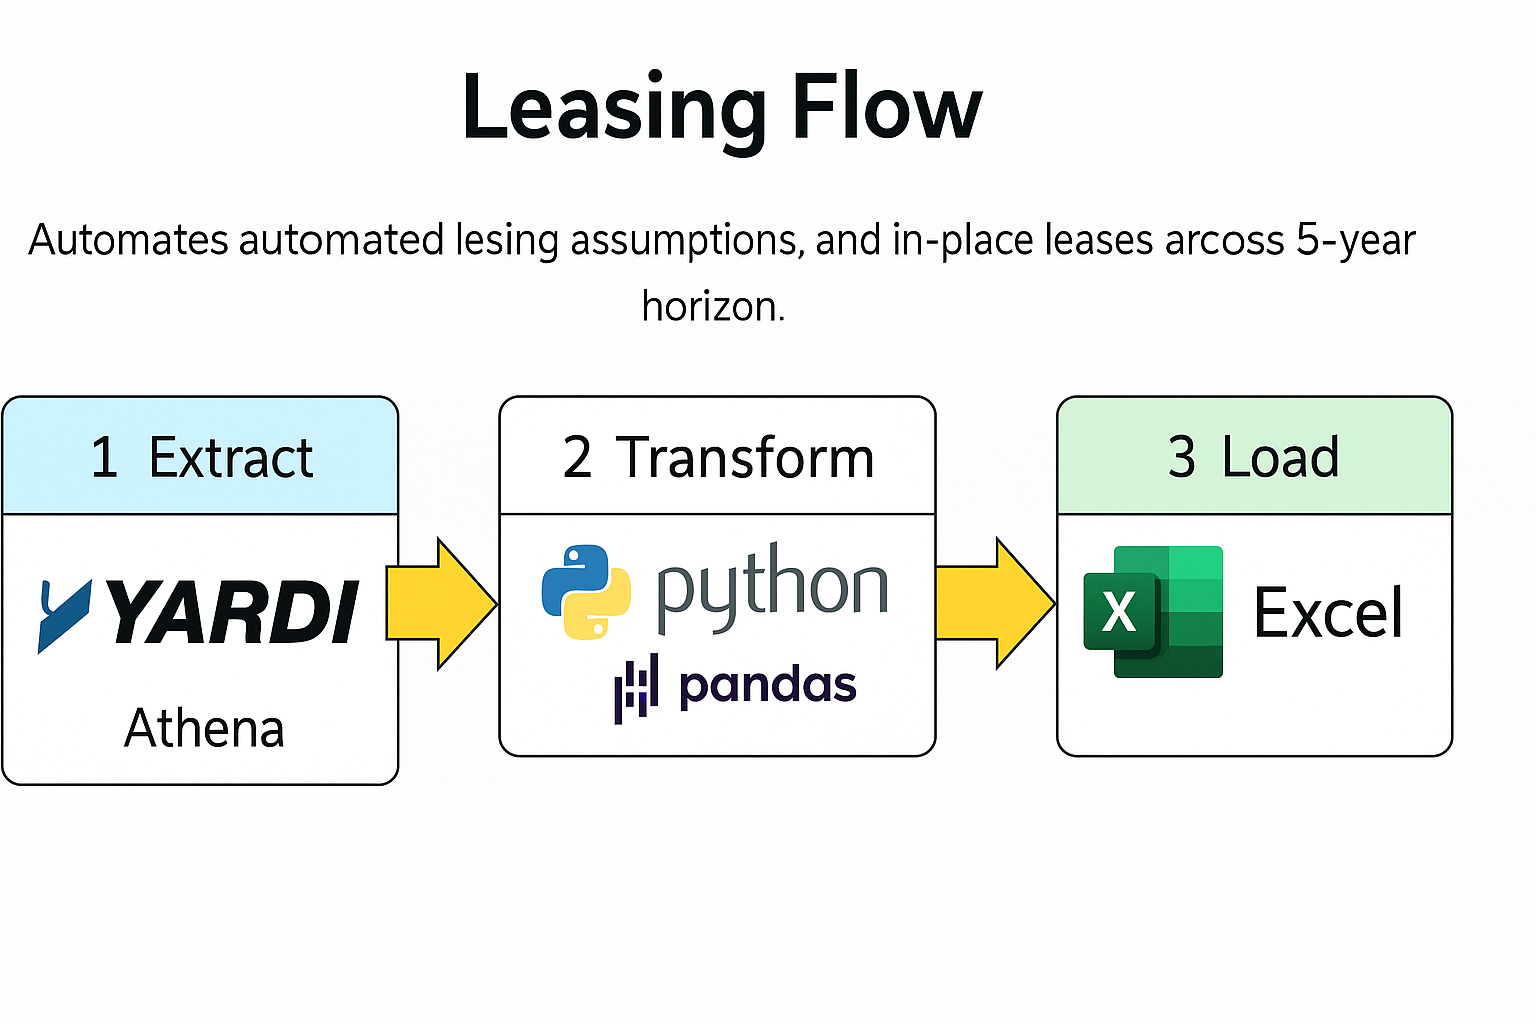
🔄 This diagram outlines how leasing data flows from raw Yardi exports and team assumptions through Python logic into monthly rent projections, vacancy tracking, and Excel reports — all fully automated.
Leasing Automation in Action
This animation walks through the 6-step leasing forecast pipeline — from pulling in-place leases from Yardi to auto-generating Excel dashboards.
① SQL pull → ② Leasing inputs → ③ Python logic → ④ Writeback → ⑤ Power Query → ⑥ Dashboard output
📝 From Input to Output
Below are examples of how leasing team assumptions entered in Excel (purple fields) directly impact summary reports. After updating assumptions, simply run the Python script and click Refresh All in Excel to instantly generate updated visuals:
🔧 Leasing Inputs (Editable Fields)
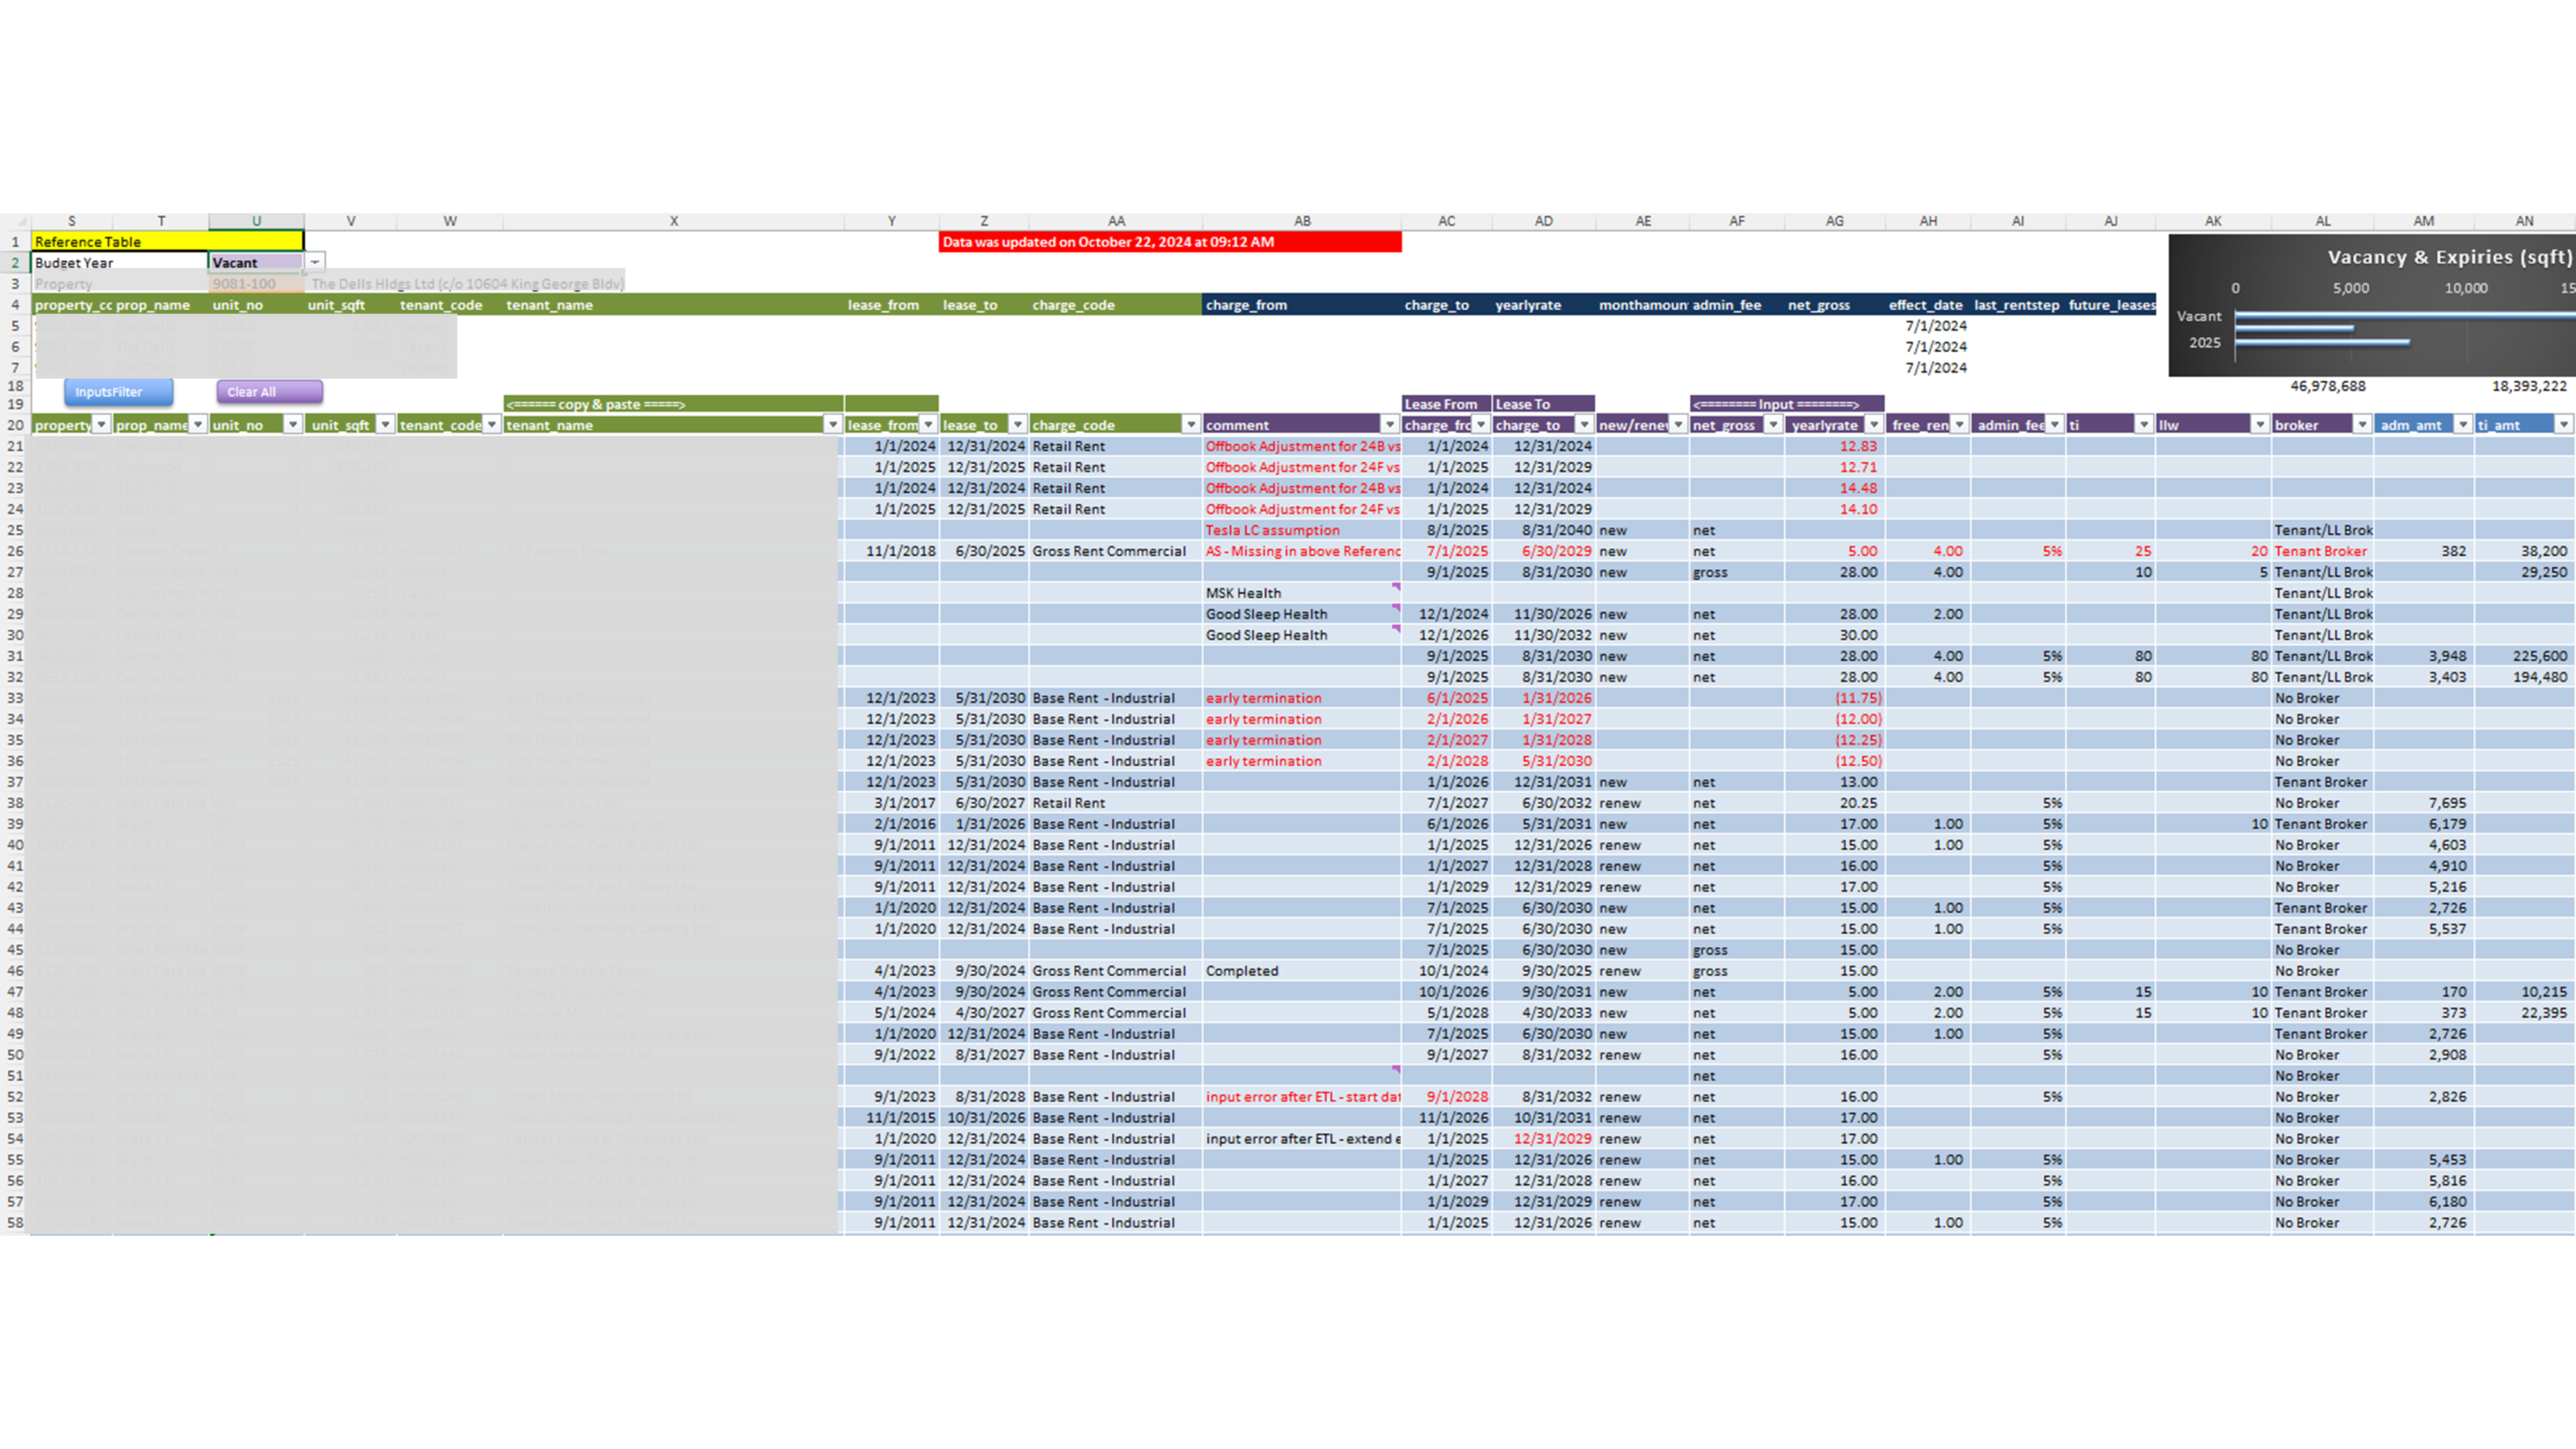
✏️ Leasing assumptions are entered here — including lease start/end dates, rates, and incentives — which directly drive downstream rent projections and KPIs.
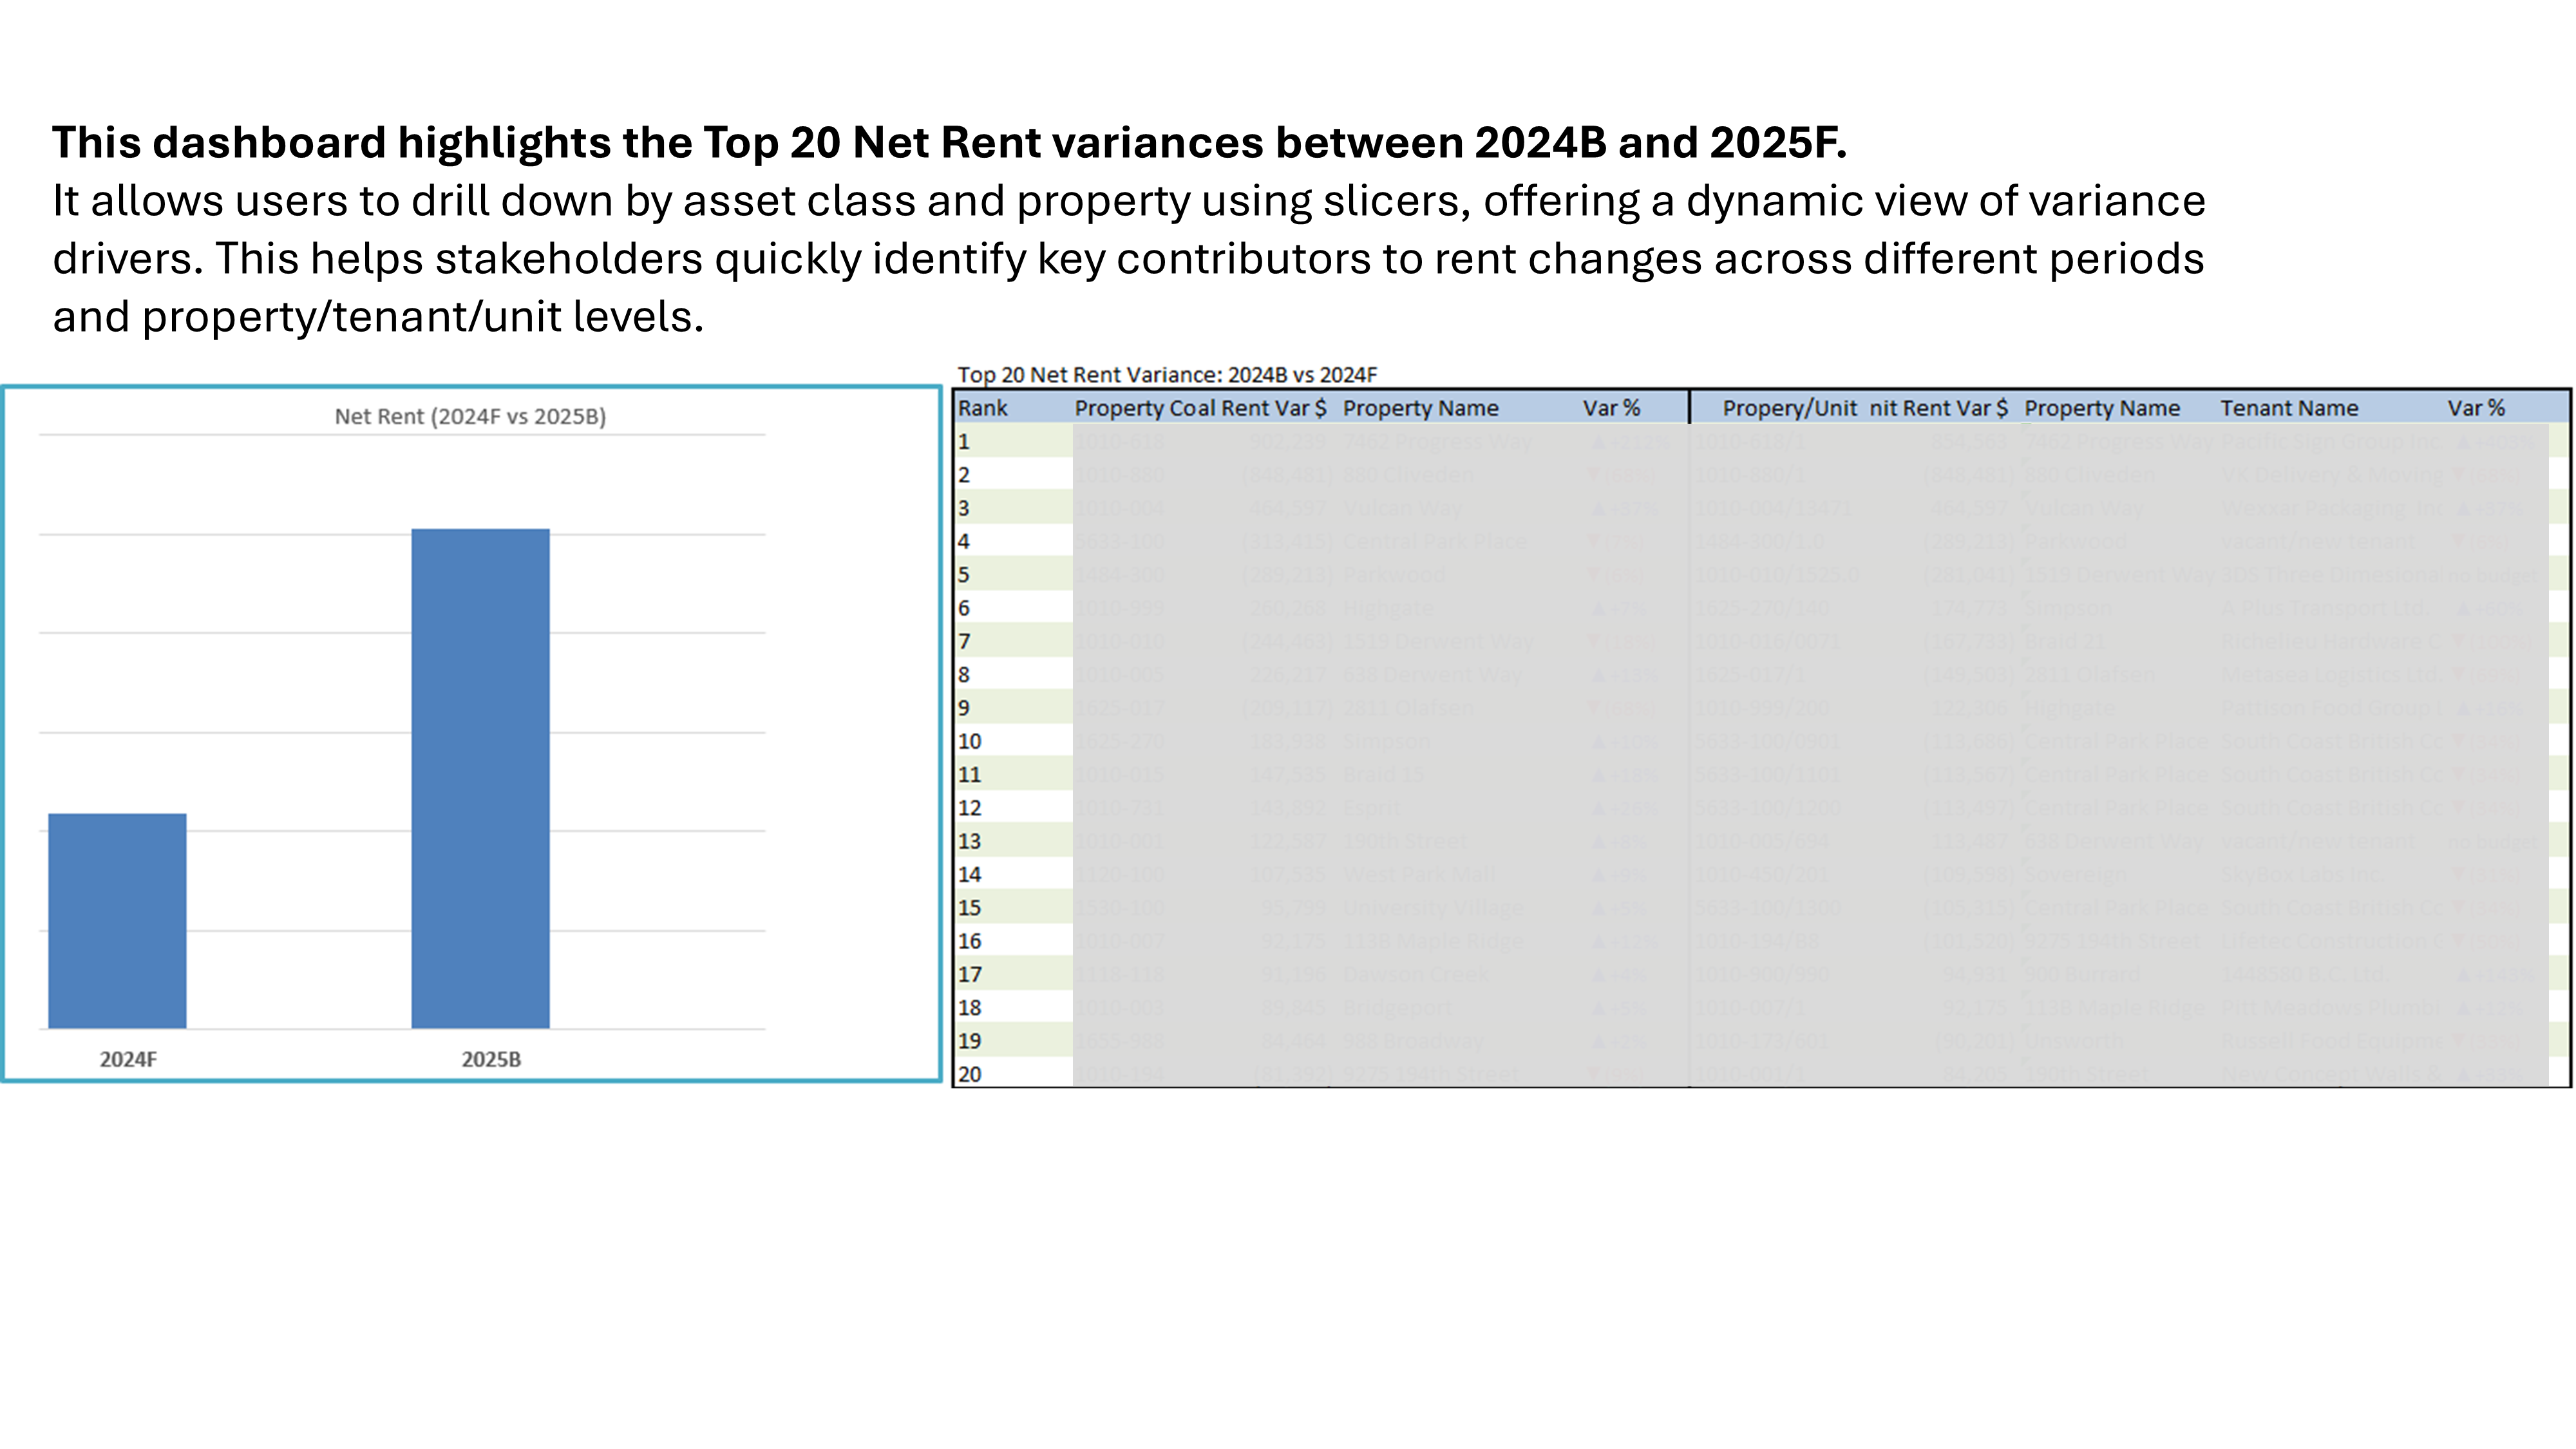
📊 Net Rent Comparison (2024F vs 2025B)
📈 Yearly Net Rent Trend (2023–2029)
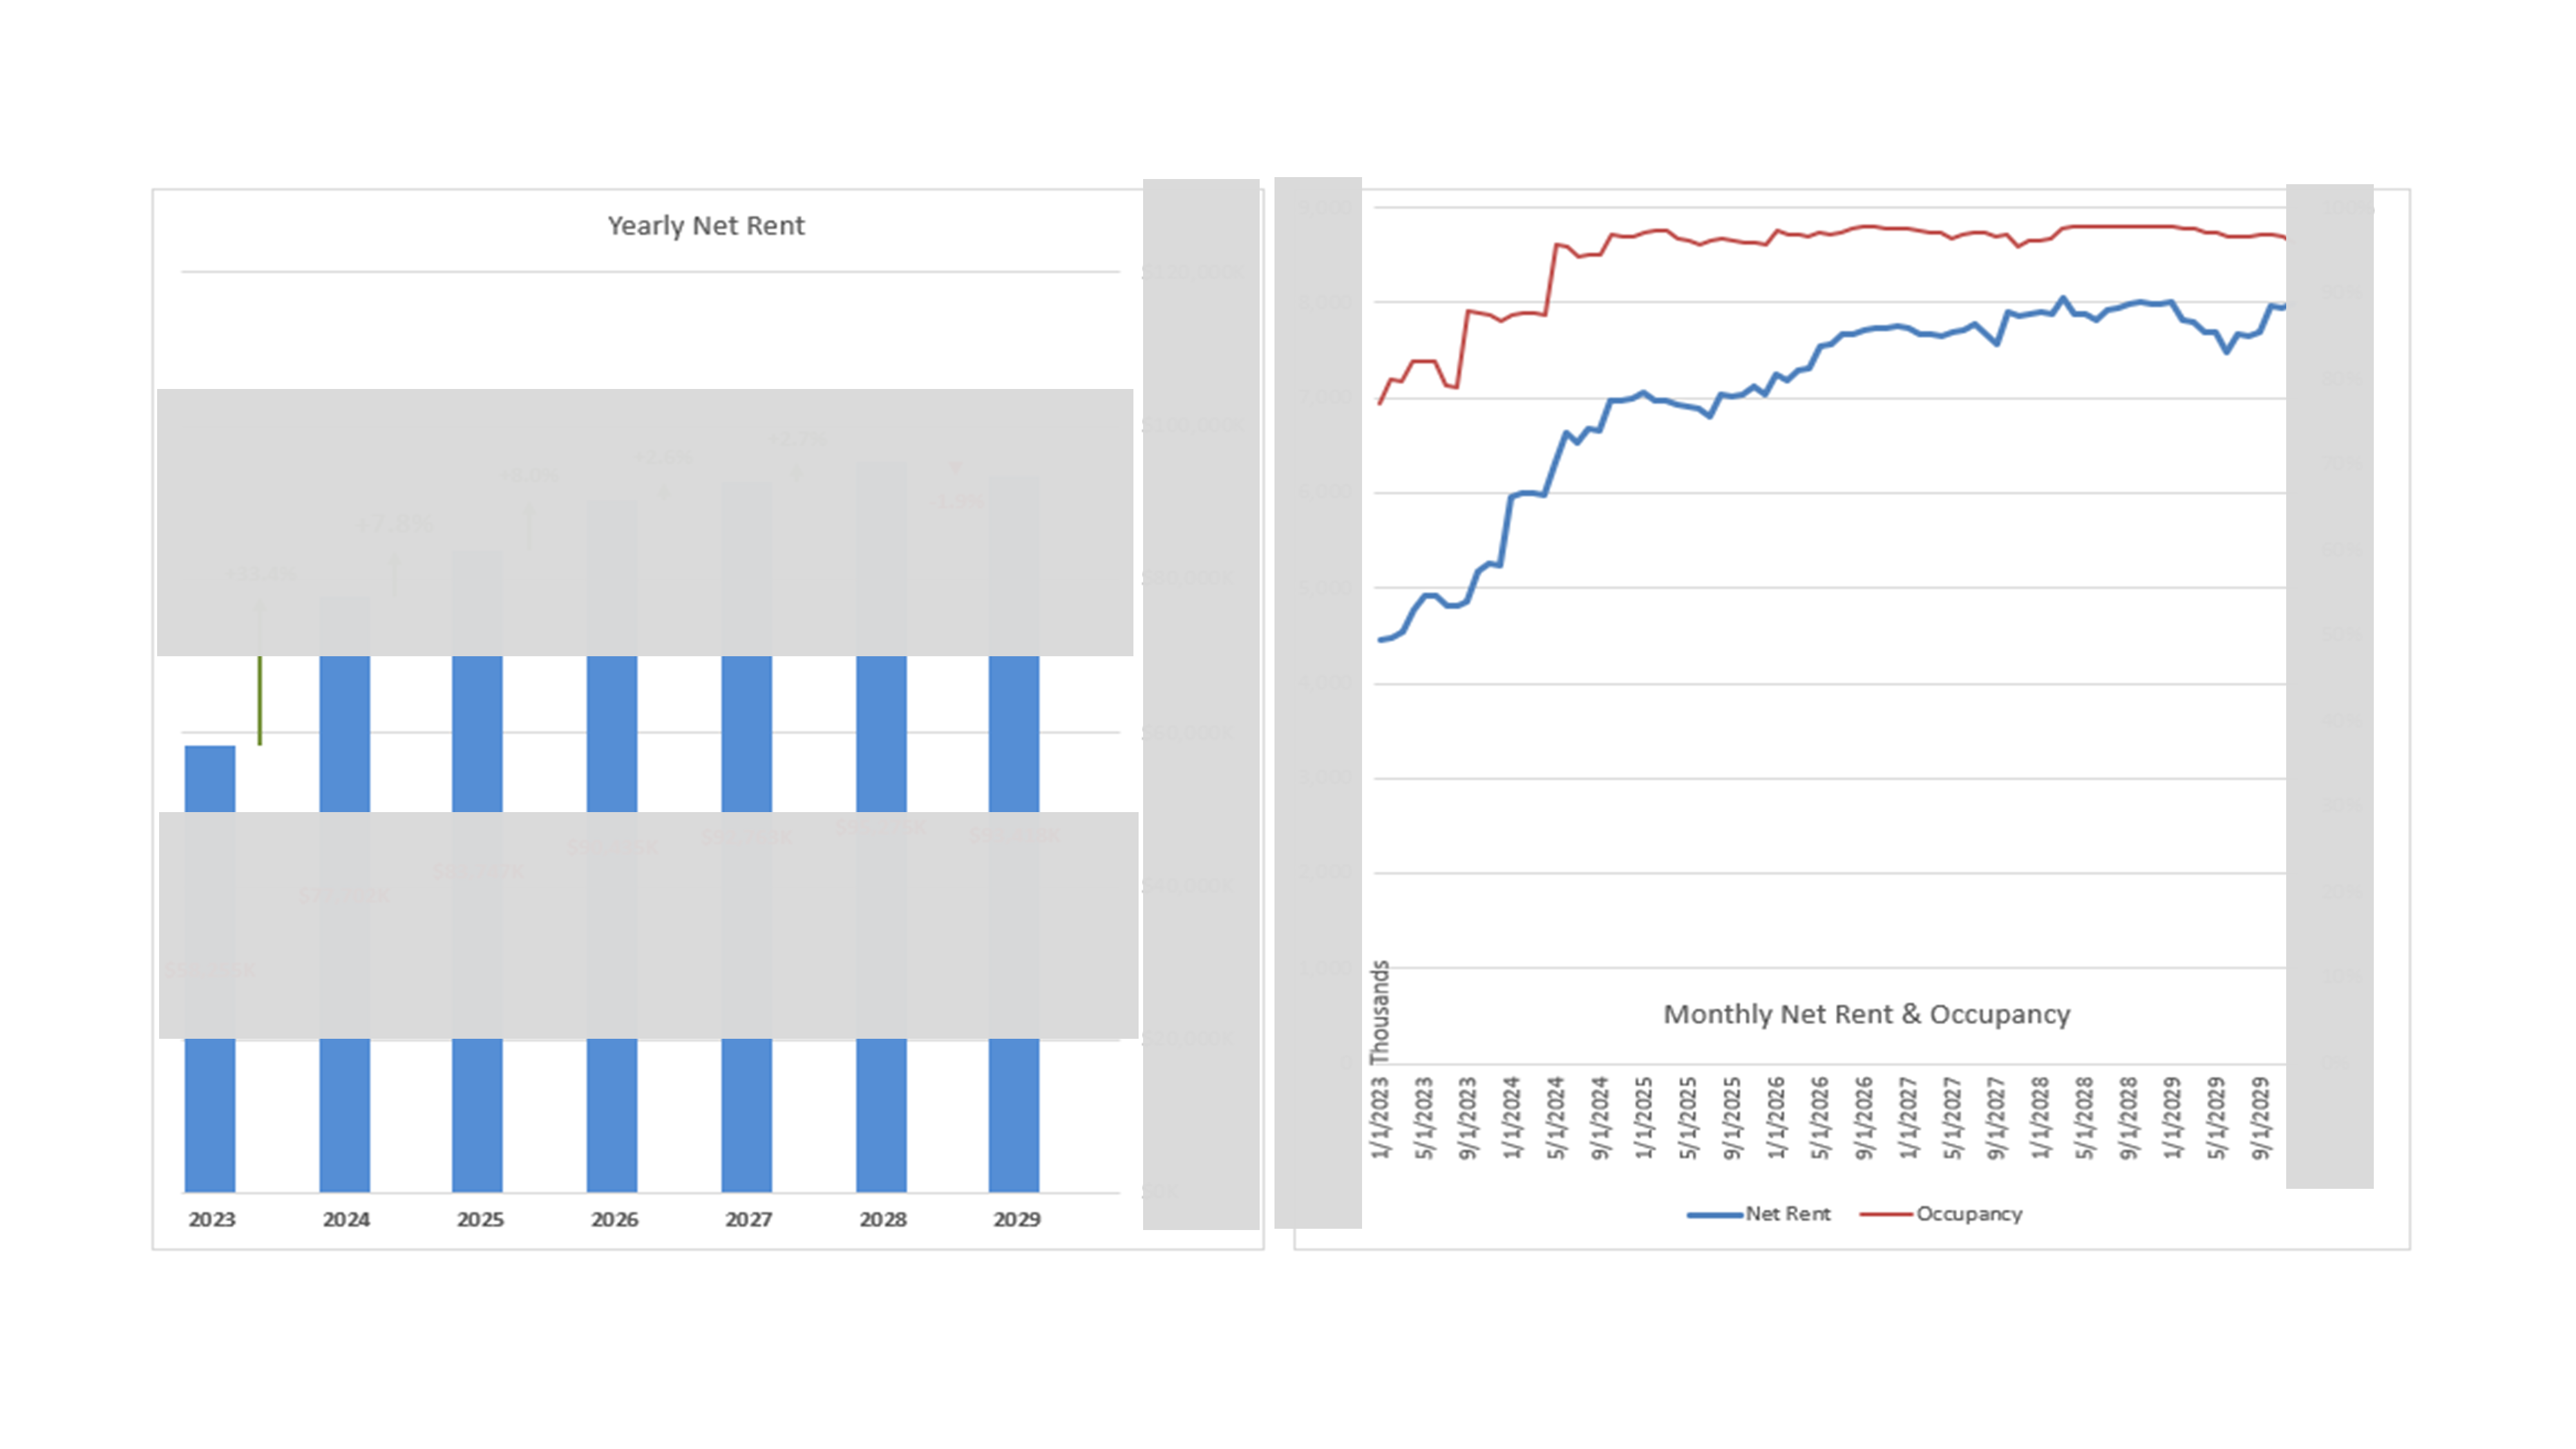
📌 These visuals help validate budget assumptions and explain key variances across time, asset class, and tenant level — making sign-off faster and more accurate.
📊 Leasing Pipeline Overview
Explore how data flows from our Yardi systems through Excel and Python automation pipelines.
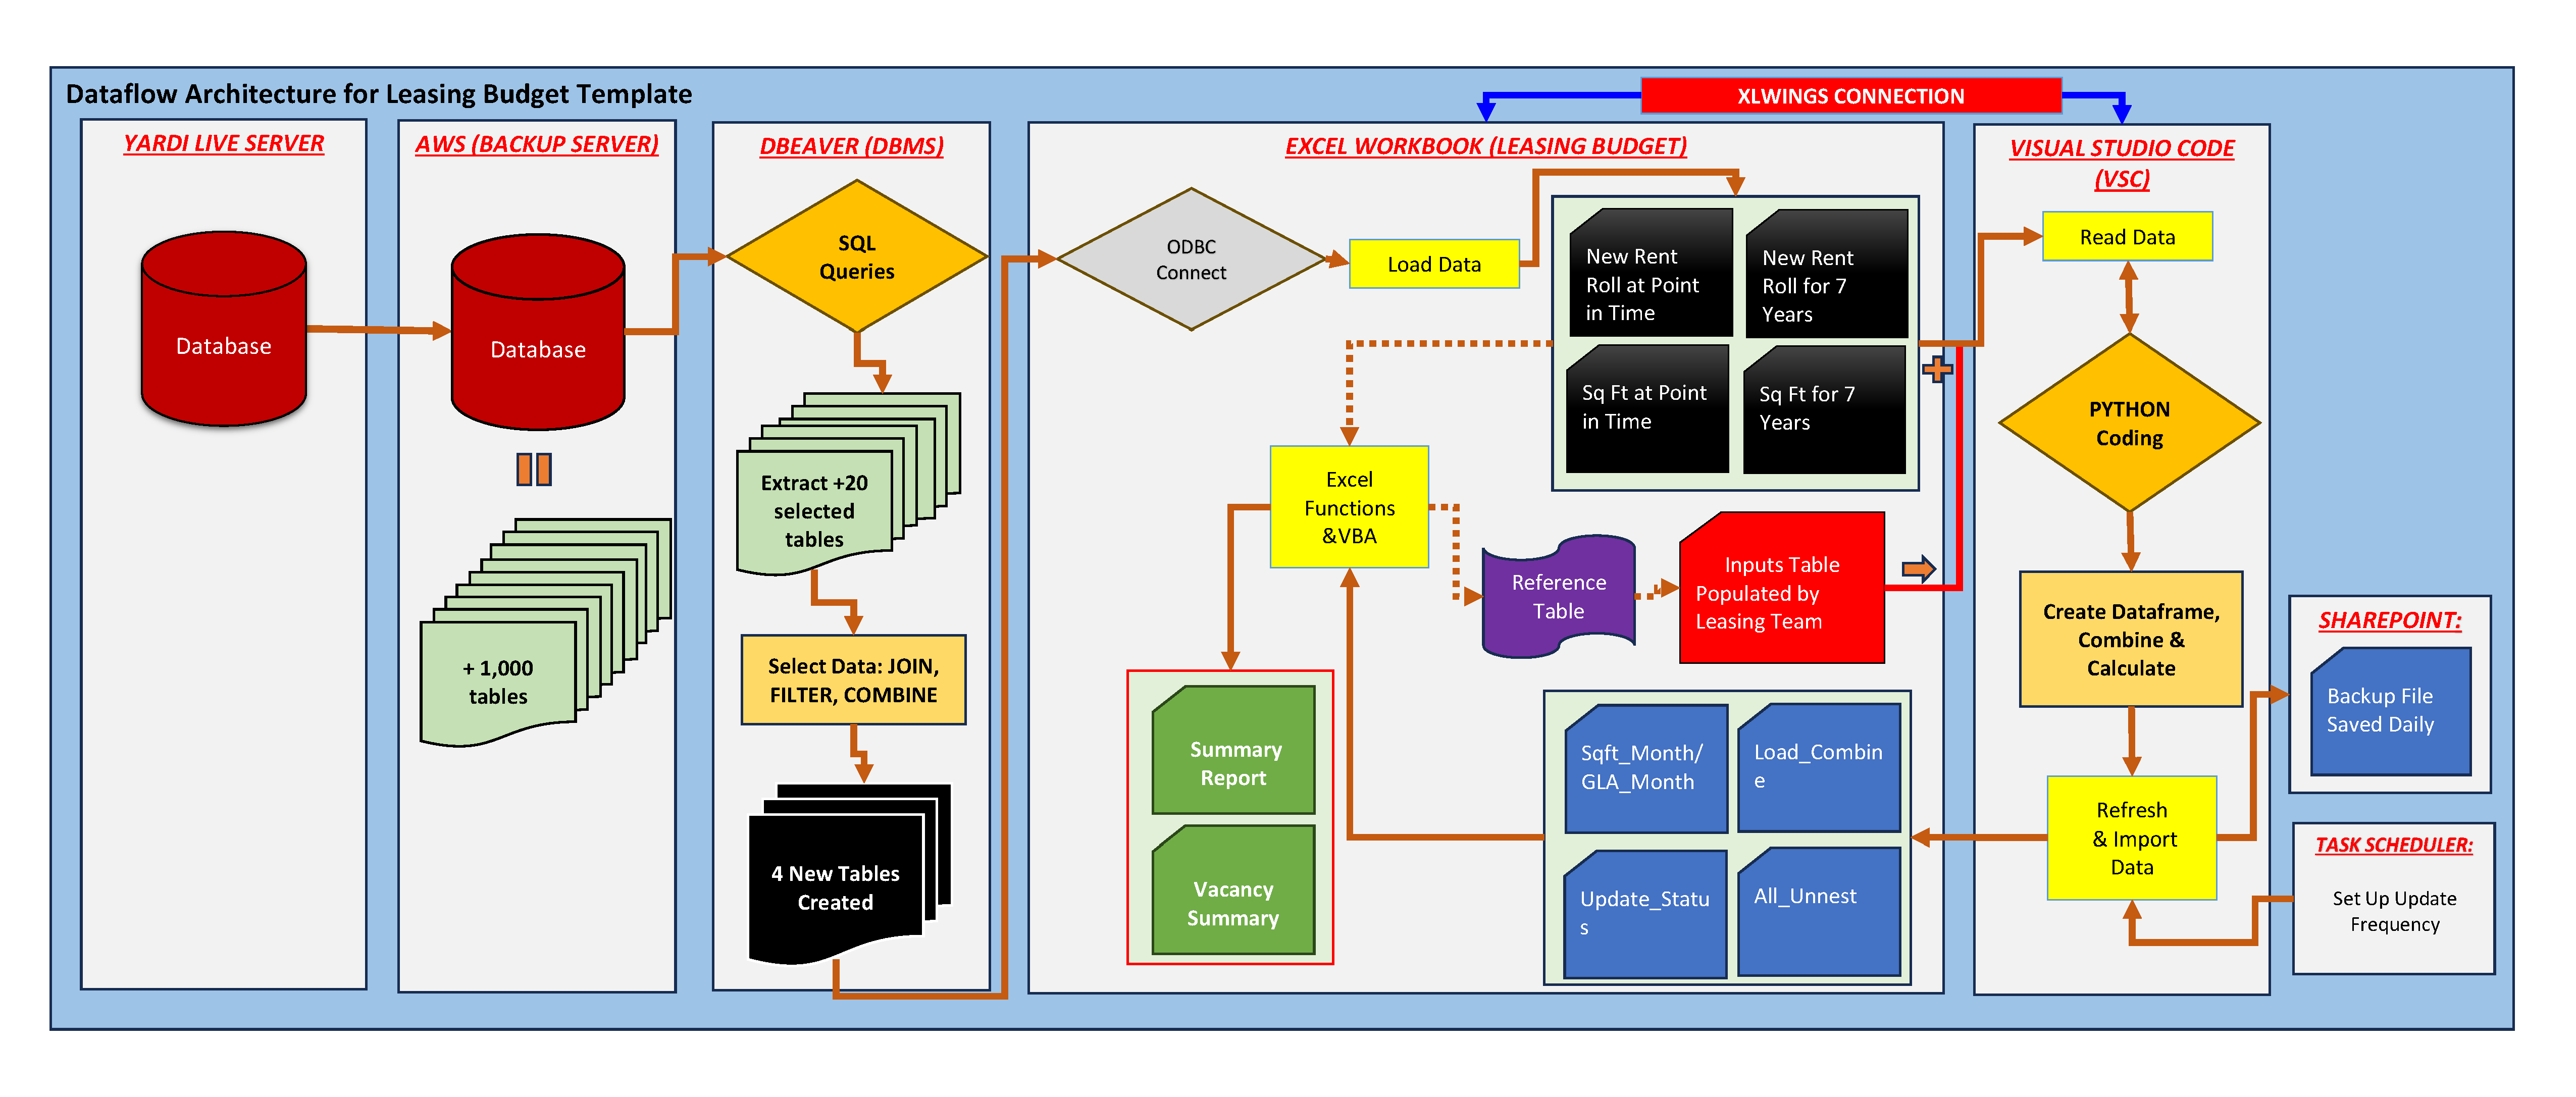
📈 Dataflow Architecture (Detail)
This visual summarizes the full-stack integration across systems:
Technical Flow
- SQL Data Pull: Extracts 4 core tables from 1,000+ via Athena, including historical and future rent rolls
- Load to Excel: Results populate
7yrBaseRent,RentRoll, andSqfttabs - Read via xlwings: Python loads both Yardi data and leasing inputs from
Inputstab - DataFrame Logic:
- Combine Yardi leases + leasing team assumptions
- Unnest each row into monthly charges (2023–2029)
- Inject free rent as negative entries
- Amortize TI, LC, admin fees across term
- Calculate NER at tenant and property level
- Vacancy Integration: Identify unoccupied months by comparing against a unit-level GLA baseline
- Output to Excel: Write to
all_unnest,GLA_Month, andSummary Report - Validation: Merge with rent roll to detect mismatch
- Backup: Archive
Inputsand validation data daily via SharePoint
🔍 Full Walkthrough: From Raw Data to Instant Rent Forecasts
This section walks through how the leasing budget automation works behind the scenes — from SQL to Excel to Python — and shows real code examples for each part of the pipeline.
1. 🔄 SQL Data Extraction
WITH dates AS (SELECT CAST('2023-1-1' AS DATE) AS effect_date),
aa AS (
SELECT *, un.scode as unit_no, round((unit_sqft * yearlyrate / 12),2) AS monthamount
FROM (SELECT
p.scode as property_code,cr.hunit as unit_code,cr.dcontractarea as unit_sqft,t.slastname as tenant_name,
t.scode as tenant_code, COALESCE(t.dtleasefrom, t.dtmovein) as lease_from, COALESCE(t.dtmoveout, t.dtleaseto) as lease_to,
cr.dtfrom as charge_from, cr.dtto as charge_to, ct.sname as charge_code, round(cr.dmonthlyamount*12/NULLIF(cr.dcontractarea,0),2) as yearlyrate, cr.hamendment, cr.hunit as dummy,
cr.dadminpercent/100 as admin_fee, CASE WHEN cr.hchargecode = 70 THEN 'gross' ELSE 'net' END AS net_gross, d.effect_date
FROM corpdata.recovery_logic cr
JOIN corpdata.tenants t ON t.hmyperson = cr.htenant JOIN corpdata.properties p ON p.hmy = t.hproperty
LEFT JOIN corpdata.attributes a ON p.scode = a.scode AND a.subgroup1 = 'IPP Core'
JOIN corpdata.property_list l ON l.hproperty = t.hproperty LEFT JOIN corpdata.units un ON un.hmy = cr.hunit
LEFT JOIN corpdata.charge_types ct ON cr.hchargecode = ct.hmy CROSS JOIN dates d
----- codes omitted -------
2. 📥 Load Queried Data into Excel
7yrBaseRentRentRollSqftInputs(for leasing assumptions)
3. 📊 Read Excel via xlwings
def load_and_combine_tables(wb):
    df_base = pd.read_excel(wb.fullname, sheet_name='7yrBaseRent')
    df_input = pd.read_excel(wb.fullname, sheet_name='Inputs')
    return pd.concat([df_base, df_input], ignore_index=True)
4. 🧮 Unnest Charges Over Time
def unnest_charges(df, wb):
    df_expanded = []
    for _, row in df.iterrows():
        for month in pd.date_range(row['start_date'], row['end_date'], freq='MS'):
            rent = row['yearly_rate'] / 12
            if month in row['free_rent_months']:
                rent = 0
            df_expanded.append({**row, 'month': month, 'monthly_rent': rent})
    return pd.DataFrame(df_expanded)
5. 🏚 Vacancy Detection
def integrate_vacancy(df, wb, all_months):
    df_sqft = pd.read_excel(wb.fullname, sheet_name='Sqft')
    df['is_vacant'] = ~df.apply(
        lambda row: (row['unit_no'], row['month']) in
        df_sqft[['unit_no', 'month']].itertuples(index=False),
        axis=1
    )
    return df
6. 💾 Output to Excel
sheet = wb.sheets['all_unnest']
sheet.range("A2").value = df_final
7. 🧾 Validation
def update_status_with_rent_roll_and_inputs(wb):
    rentroll = pd.read_excel(wb.fullname, sheet_name='RentRoll')
    status = df_final.merge(rentroll, on='unit_no', how='left', suffixes=('', '_actual'))
    status['discrepancy'] = status['monthly_rent'] != status['monthly_rent_actual']
    return status
8. 🔁 Backup and Refresh
Backups of inputs and summary reports are archived daily to SharePoint using Windows Task Scheduler.
🧪 Python Modules
🔁 1. load_and_combine_tables(wb)
all_charges_sheet = wb.sheets["7yrBaseRent"]
all_charges_range = all_charges_sheet.range("A1").expand()
all_charges_df = all_charges_range.options(pd.DataFrame, header=1, index=False).value
all_charges_df['Source'] = 'yardi'
all_charges_df['unit_no'] = all_charges_df['unit_no'].apply(lambda x: "'" + str(x) if pd.notna(x) else x)
all_charges_df = all_charges_df[all_charges_df['unit_no'].str.strip("'").notna() & (all_charges_df['unit_no'].str.strip("'") != "")]
inputs_sheet = wb.sheets["Inputs"]
inputs_range = inputs_sheet.range("S27:AL3000")
----- codes omitted -------
📆 2. unnest_charges(df1, wb)
global start_date, end_date, all_months; df_final = df1.copy(); df_final['unit_no'] = df_final['unit_no'].astype(str)
df_final = df_final[df_final['unit_no'].notna() & (df_final['unit_no'] != '')]
for month_end in all_months: df_final[month_end.strftime('%Y-%m-%d')] = np.nan
for index, row in df_final.iterrows():
if pd.notna(row['yearlyrate']) and pd.notna(row['unit_sqft']): charge_from = max(pd.Timestamp(row['charge_from']), start_date)
charge_to = min(pd.Timestamp(row['charge_to']), end_date)
for month in all_months:
month_start = month.to_timestamp(how='start')
month_end = month.to_timestamp(how='end')
----- codes omitted -------
🏢 3. integrate_vacancy(df_final, wb, all_months)
sqft_sheet = wb.sheets['sqft']; sqft_range = sqft_sheet.range('A1').expand()
sqft_df = sqft_range.options(pd.DataFrame, header=1, index=False).value; sqft_df['unit_no'] = "'" + sqft_df['unit_no'].astype(str)
unit_entries = []
for _, unit in sqft_df.iterrows(): property_code = unit['property_code']; unit_no = unit['unit_no']; unit_record = {'Source': 'vacancy', 'property_code': property_code, 'prop_name': None, 'unit_no': unit_no}; ----- omitted codes ------- ----- codes omitted -------
📏 4. process_sqft_month(wb)
global start_date, end_date, all_months; all_months = pd.date_range(start_date, end_date, freq='ME').strftime('%Y-%m-%d')
sqft_sheet = wb.sheets['sqft']; sqft_data_range = sqft_sheet.range('M1').expand('table')
sqft_data_df = sqft_data_range.options(pd.DataFrame, header=1, index=False).value.dropna(subset=['start_date']).sort_values(by='start_date')
data_rows = [] columns = ['property_code', 'unit_no', 'start_date'] + list(all_months)
for _, group in sqft_data_df.groupby(['property_code', 'unit_no']):
group = group.reset_index(drop=True)
for idx, row in group.iterrows():
----- codes omitted -------
📊 5. update_status_with_rent_roll_and_inputs(wb)
# Compares forecast vs actual data for reporting and control validation
pass # (Function logic omitted here — add if available)
----- codes omitted -------
All Excel interaction handled via xlwings — ensuring seamless link to open or saved workbooks.
🛠 Challenges Solved
- Duplicate assumptions: Detected overlap with activated leases → override logic added
- Excel memory limits: Large formula-based workbook → replaced with Python calculations
- Manual errors in rent roll match: Created full validation logic across merged keys
🔍 Reflections
- This was not just a coding task — it redefined how leasing forecasts are created and validated
- Team buy-in increased as confidence in data grew
- Demonstrated value of domain-specific automation in Finance